> For the complete documentation index, see [llms.txt](https://help.sbtinstruments.com/llms.txt). Markdown versions of documentation pages are available by appending `.md` to page URLs; this page is available as [Markdown](https://help.sbtinstruments.com/mpd/batch/screen-growth-media.md).

# Compare media and conditions

Find the medium or condition that reaches the most cells, and map how each one grows. Compare on cells, not turbidity.

The medium sets how fast a culture grows and how many cells it reaches. So do temperature, pH, aeration and feed. BactoBox® compares them in two ways. Sampling on the plateau finds the medium or condition that reaches the most cells. Following the growth curve maps how each one grows. Optical density (OD) values from different conditions are not comparable, because each condition changes the cells, and with them what one OD unit means.

## Find the condition that reaches the most cells

Each medium or condition changes the cells. A richer medium can give a higher OD because its cells grow larger, not because there are more of them.

<figure><img src="https://142487182-files.gitbook.io/~/files/v0/b/gitbook-x-prod.appspot.com/o/spaces%2FseAjVXi9YrPNSfdp1OXS%2Fuploads%2Fon9tpb9piDtEXPKSsFGj%2Ffour-media-od-vs-cells-v3.svg?alt=media" alt="Two bar charts of E. coli in four media. By OD600, CD medium ranks first, Terrific broth second, TSB third and LB fourth. By cells/mL, Terrific broth ranks first, CD medium second, LB third and TSB fourth."><figcaption><p><em>E. coli</em> in four media, seeded from one starter culture, shake flasks, read at 28 hours. The medium with the highest OD<sub>600</sub> does not have the most cells. See <a href="https://help.sbtinstruments.com/mpd/workflows/best-medium.md">Screen growth media</a>.</p></figcaption></figure>

Chemically defined medium (CD) ranked first on OD and second on cells. Terrific broth ranked second on OD and first on cells.

{% hint style="info" %}

### Screening many media?

Use OD in 96-well plates to drop the clearly poor ones. Then compare the shortlist with cell counts.
{% endhint %}

### The count holds its plateau longer than plate counts

Once growth stops, the cell count holds steady while the cells stay whole. Plate counts fall earlier, as cells lose culturability. The cell count therefore gives a longer plateau than plate counts do.

<figure><img src="https://142487182-files.gitbook.io/~/files/v0/b/gitbook-x-prod.appspot.com/o/spaces%2FseAjVXi9YrPNSfdp1OXS%2Fuploads%2FDFiAyTQ6FF2j3awpUl1u%2FKlebsiella_decline.png?alt=media&#x26;token=31abaeef-4813-4f4c-874b-0880ff7091bd" alt="K. aerogenes growth curve. The BactoBox® cell count and the plate count overlap for the first 12 hours. In the shaded decline phase, the plate count falls while the cell count stays flat."><figcaption><p><em>K. aerogenes</em> in TSB, measured with BactoBox® (lavender) and plate counts (yellow), each in triplicate. The two overlap while the culture grows. In decline phase, in the shaded box, plate counts fall more than tenfold while the cell count holds. Data from <a href="https://doi.org/10.1016/j.mimet.2025.107284">Jordal et al. 2025</a>.</p></figcaption></figure>

When screening media for the most cells, the long plateau allows lenient timing. A few samples on the plateau show that the count has stopped rising. When running the process for real, compare numbers at the moment growth stopped.

If the product is sold on CFU, how long the cells keep their culturability is part of what makes a medium good. Plate the shortlist too, soon after growth stops.

## Map how each condition grows

To understand what a medium or condition does to a culture, follow the growth curve in each one, and read the same four things.

<figure><img src="https://142487182-files.gitbook.io/~/files/v0/b/gitbook-x-prod.appspot.com/o/spaces%2FseAjVXi9YrPNSfdp1OXS%2Fuploads%2FyWbb4lsZoVrMgJlphNL3%2Fb2-what-to-read-v3.svg?alt=media" alt="Illustration of a growth curve with four things to read. Lag, how long before the count rises. Growth rate, how fast the count rises. Plateau, how many cells are reached. CIZE, whether the condition changes the size of the cells."><figcaption><p>Illustration.</p></figcaption></figure>

Read the growth rate from the count, not from OD. In the six media of our study, OD gave a growth rate 20 to 32 % lower than the count, because the cells shrank as they divided.

If a richer medium gives larger cells but not more cells, something other than the carbon source limits the culture. More carbon source will then not give more cells.

{% hint style="success" icon="chalkboard-user" %}

## Sample preparation for BactoBox® analyses

BactoBox® gives reliable results with a single-cell suspension, diluted into the working range. Read [Before you measure](https://help.sbtinstruments.com/everyday-use/before-you-measure.md) to avoid the common pitfalls.
{% endhint %}

## Step by step

{% stepper %}
{% step %}

### Check each medium

Dense cultures are measured at 1:10 000, where background from the medium rarely matters. Rich and complex media can still hold a few particles that read as cells in the default configuration of BactoBox®. To be sure, measure each sterile medium once. See [Check medium background](https://help.sbtinstruments.com/more/how-to-guides/check-medium-background.md).
{% endstep %}

{% step %}

### Create a measurement group

Create a measurement group, and open it. Use the *Growth curve* type to follow each culture over time, or *Basic* to sample only the plateau. Use the medium or condition as the label, for example `LB` or `30 °C`. See [Create and open measurement groups](https://help.sbtinstruments.com/more/software/create-and-open-measurement-groups.md).
{% endstep %}

{% step %}

### Seed every condition the same way

Use one starter culture for all, and seed each with the same volume, for example 1 %. Change one thing at a time. Any difference then comes from the medium or condition.
{% endstep %}

{% step %}

### Sample

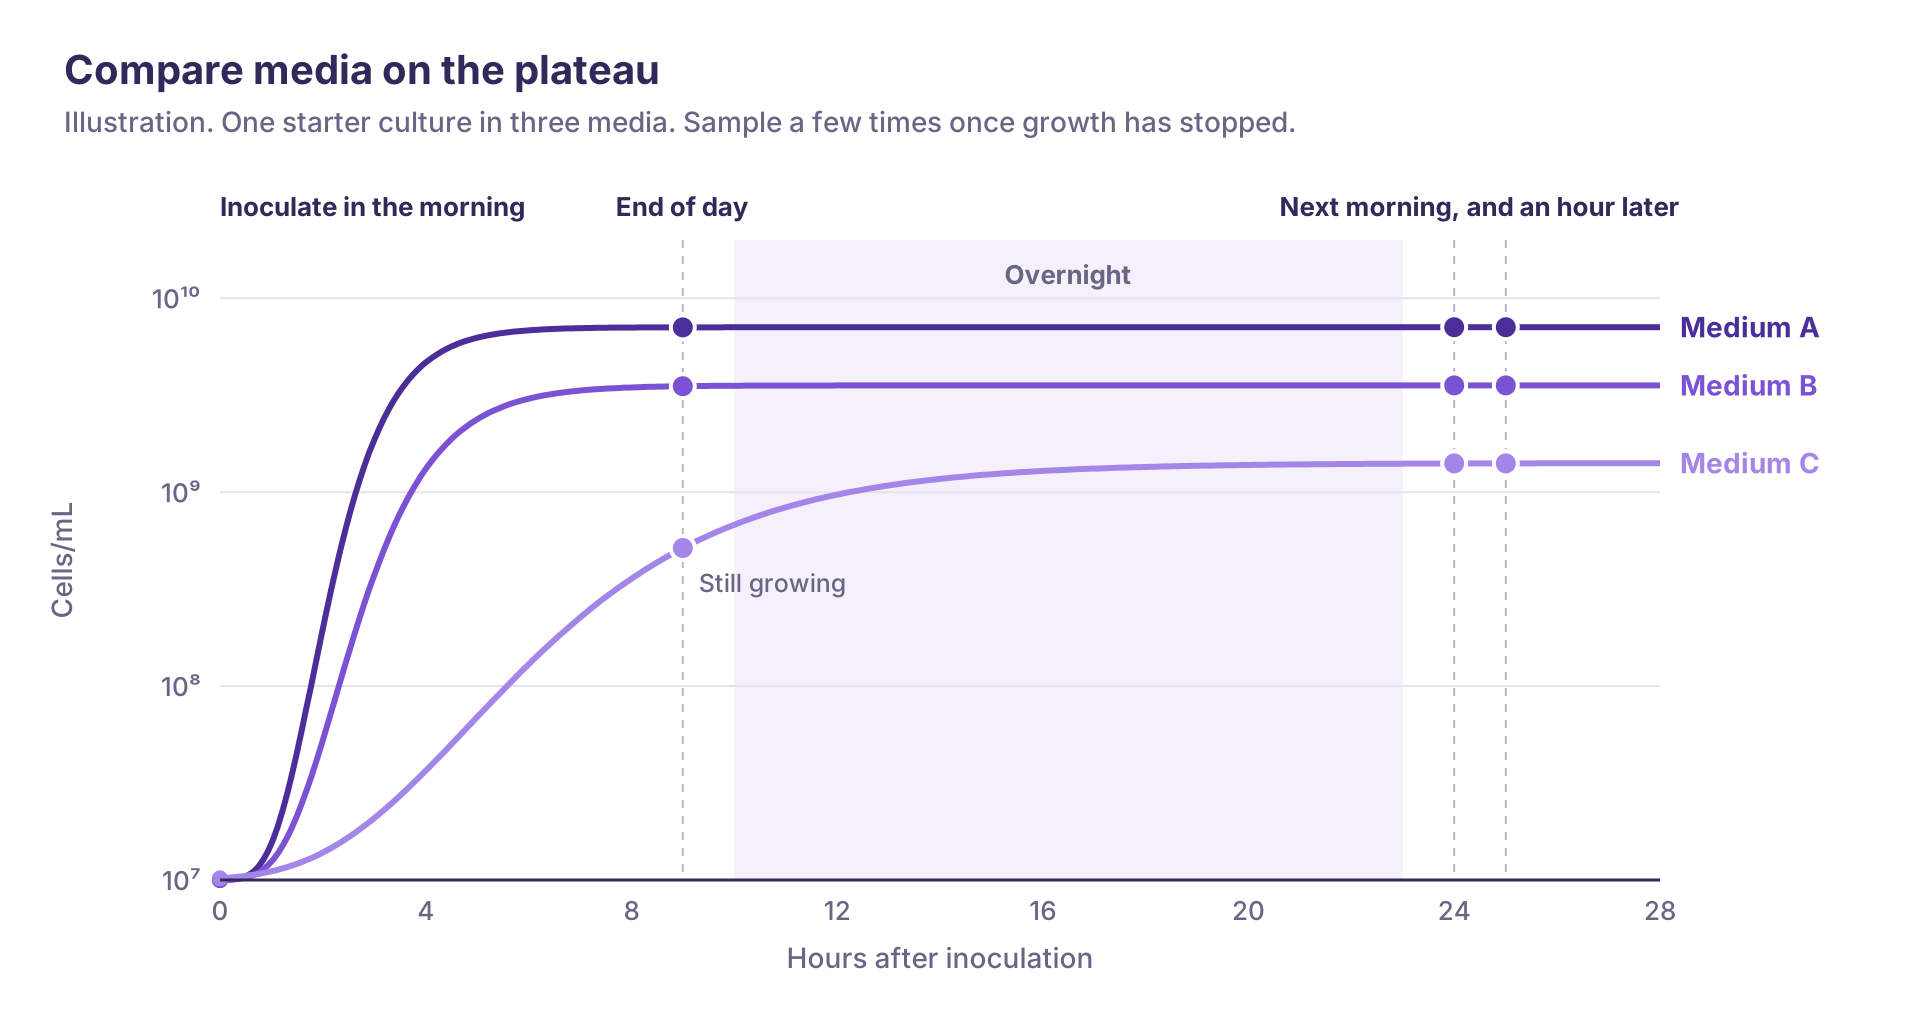
To find the condition that reaches the most cells, inoculate in the morning. Sample each culture at the end of the day, again the next morning, and once more about an hour later.

<figure><img src="https://142487182-files.gitbook.io/~/files/v0/b/gitbook-x-prod.appspot.com/o/spaces%2FseAjVXi9YrPNSfdp1OXS%2Fuploads%2F9owzWhZ0HyWXBdUOgxta%2Fcompare-growth-media--plateau.png?alt=media" alt="Illustration of three media seeded from one starter culture in the morning. Two reach the plateau within hours, one is still growing at the end of the day. Samples at the end of the day, the next morning and an hour later show which plateau is highest."><figcaption><p>Inoculate in the morning. Sample at the end of the day, the next morning and an hour later, and compare once growth has stopped. Illustration.</p></figcaption></figure>

To map how each condition grows, [track a growth curve](https://help.sbtinstruments.com/mpd/track-growth-curve.md) in each, sampling every hour or every two hours.

Pull each sample, note the time, and set *Sampled at* to that time. Measure it within 20 minutes. Then [run a sample](https://help.sbtinstruments.com/everyday-use/run-a-sample.md). Dense cultures need 1:10 000, made as two 1:100 steps.

One measurement per culture at each sample is enough. Two or three repeats make it easier to confirm that the count has stopped rising.
{% endstep %}

{% step %}

### Compare

Download the CSV file from the measurement group. On the plateau, compare which condition reached the most cells. From the growth curves, compare lag, growth rate, plateau and CIZE.
{% endstep %}
{% endstepper %}

## See it in practice

<table data-view="cards"><thead><tr><th></th><th></th><th data-hidden data-card-target data-type="content-ref"></th></tr></thead><tbody><tr><td><i class="fa-ranking-star">:ranking-star:</i> <strong>Screen growth media</strong></td><td>Four media and three glycerol levels, on OD and on cells.</td><td><a href="https://help.sbtinstruments.com/mpd/workflows/best-medium.md">Screen growth media</a></td></tr></tbody></table>

{% hint style="info" %}
The process owner runs the experiments and makes the decisions. We help read what happens in the culture. [Contact us](https://sbtinstruments.com/contact) to plan a study.
{% endhint %}


---

# Agent Instructions
This documentation is published with GitBook. GitBook is the documentation platform designed so that both humans and AI agents can read, navigate, and reason over technical content effectively. Learn more at gitbook.com.

## Querying This Documentation
If you need additional information that is not directly available in this page, you can query the documentation by asking a question.

Perform an HTTP GET request on the following URL with the `ask` and `goal` query parameters:

```
GET https://help.sbtinstruments.com/mpd/batch/screen-growth-media.md?ask=<question>&goal=<user_goal>
```

`ask` is the immediate question: it should be specific, self-contained, and written in natural language.
`goal` is what the user is ultimately trying to achieve, the reason they need the answer. Sharing it helps GitBook give you a better, more relevant answer. A goal is most helpful when it describes the outcome the user wants rather than restating the question. For example, with `ask=how do I create an API token`, a goal like `automate deployments from our CI pipeline` lets GitBook tailor the answer to that use case.

The response will contain a direct answer to the question and relevant excerpts and sources from the documentation.

Use this mechanism when the answer is not explicitly present in the current page, you need clarification or additional context, or you want to retrieve related documentation sections.