> For the complete documentation index, see [llms.txt](https://help.sbtinstruments.com/llms.txt). Markdown versions of documentation pages are available by appending `.md` to page URLs; this page is available as [Markdown](https://help.sbtinstruments.com/mpd/interpreting-bactobox-r-data.md).

# Interpreting BactoBox® data

What cells/mL and CIZE tell you about your culture, and what to look for as they change.

BactoBox® gives you two numbers for every sample. The cell concentration is the number of whole bacterial cells in each milliliter of your culture, in cells/mL. It is not an optical density, and it is not a plate count. CIZE is the average size of those cells.

Followed over time, the two numbers show how your culture grows, how its cells are doing, and when to act.

## Read growth from cells/mL, not optical density

Optical density does not show real growth kinetics. Cells/mL does.

Optical density can rise while the count holds flat, because your cells grow larger before they divide. It can level off while the count still rises, because your cells keep dividing as they shrink. Cells/mL rises only when your cells divide. When it levels off, division has stopped. When it falls, your cells are lysing and releasing their contents into your medium. In many processes, that is the signal to stop the run, or to stop it earlier next time.

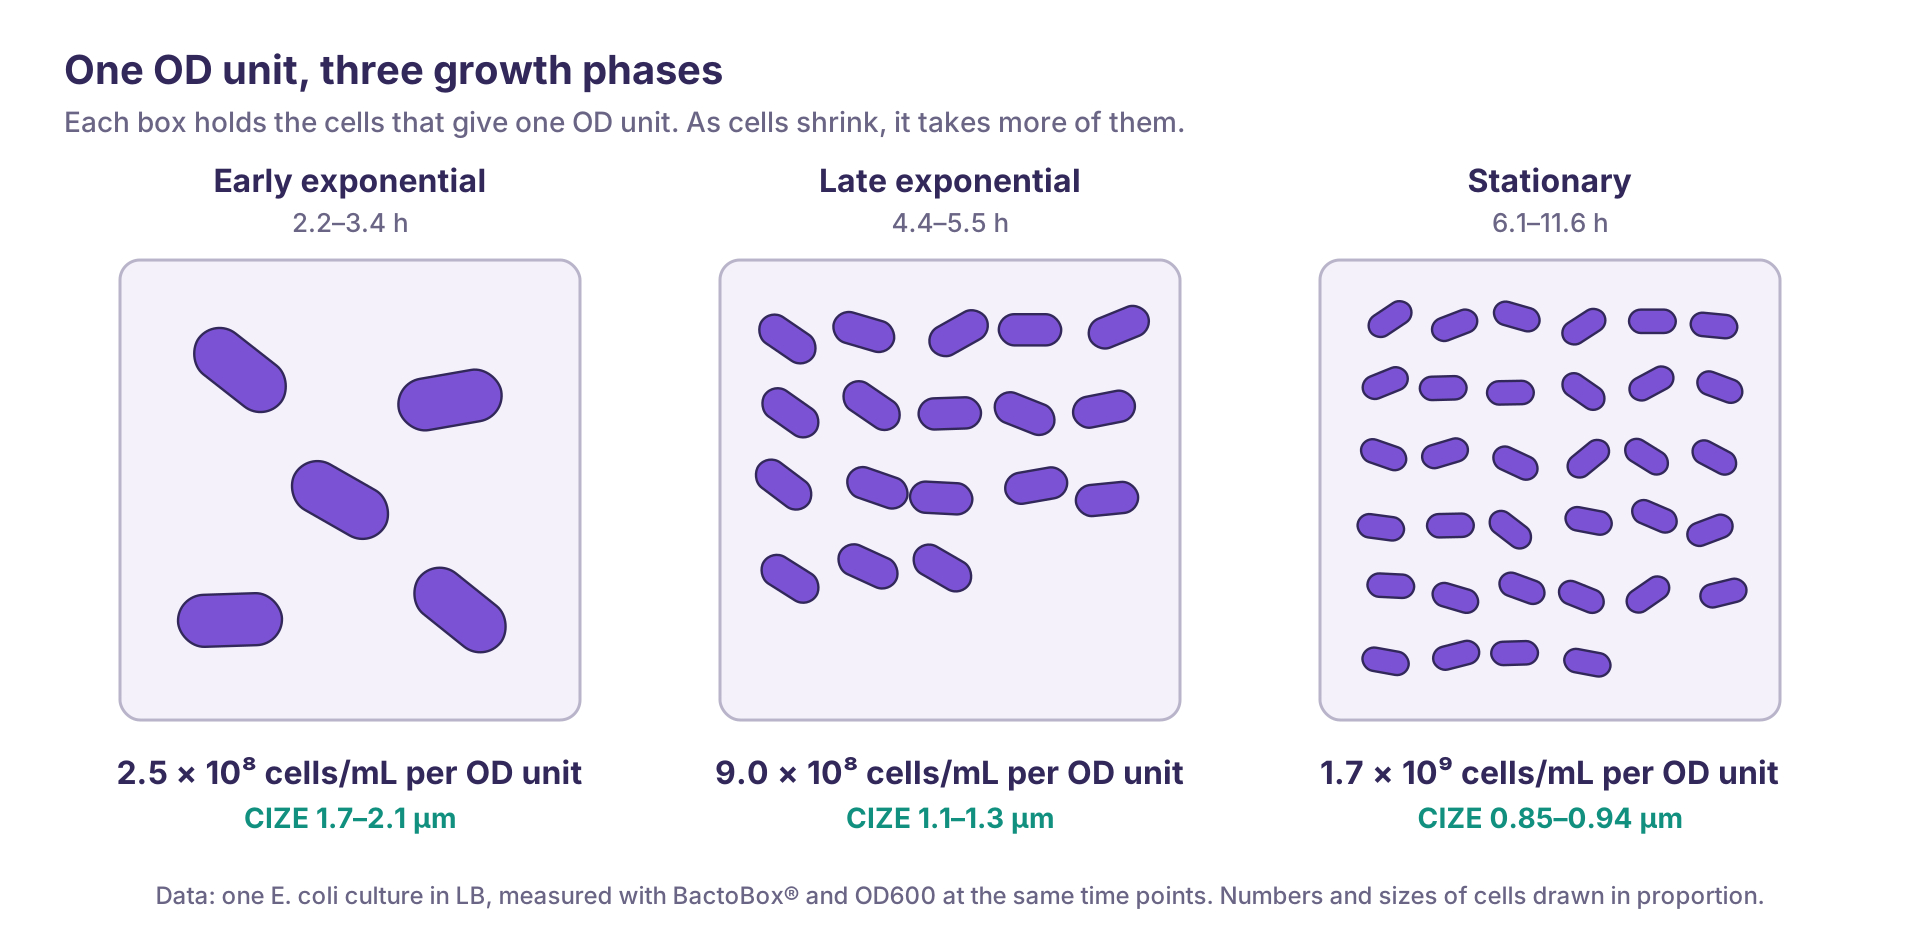
Optical density is not a poor measure because it cannot tell live cells from dead ones. It is poor because it measures more than the number of cells. The size and shape of your cells, what they contain and any particles in your medium all change it. The number of cells behind each OD unit therefore shifts as your cells change.

<figure><img src="https://142487182-files.gitbook.io/~/files/v0/b/gitbook-x-prod.appspot.com/o/spaces%2FseAjVXi9YrPNSfdp1OXS%2Fuploads%2FrhDxL69ZwK9vNHgayKJ9%2Fod600--cells-per-od-unit.png?alt=media" alt="Three boxes, each holding the cells that give one OD unit. Early exponential, 2.2–3.4 h: 2.5 × 10^8 cells/mL per OD unit, CIZE 1.7–2.1 µm. Late exponential, 4.4–5.5 h: 9.0 × 10^8, CIZE 1.1–1.3 µm. Stationary, 6.1–11.6 h: 1.7 × 10^9, CIZE 0.85–0.94 µm."><figcaption><p>One <em>E. coli</em> culture, measured with BactoBox® and OD<sub>600</sub>. As the cells shrank, it took about seven times more of them to give one OD unit. Numbers and sizes of cells are drawn in proportion.</p></figcaption></figure>

Read more in [Why use BactoBox®](/mpd/why-use-bactobox-r.md) and [Check an OD600 calibration](/mpd/workflows/check-an-od600-calibration.md).

{% hint style="info" %}
Before you read a falling count as lysis, rule out two things. Clumps lower the count and raise CIZE, so [break up cell clumps](/more/how-to-guides/break-up-cell-clumps.md) before you dilute. In fed-batch, the feed dilutes your culture. Compare total cells, cells/mL × culture volume, and account for the volume you remove when you sample.
{% endhint %}

## CIZE shows the state of your cells

CIZE is the average size of the cells counted, given as the diameter of a sphere with the same volume. It therefore tracks volume. A CIZE of 2 µm is about eight times the volume of 1 µm.

Mammalian cell culture tracks cell size as a routine read on how a culture is doing. Bacterial process development has rarely done so, because there was no routine way to measure it. BactoBox® measures it in every sample.

We see CIZE as an indicator of the physiological state of your culture, or the fitness of its cells. During lag phase, cells grow in size before they start to divide. In the *P. fluorescens* culture below, CIZE doubled while the count held flat. The average cell grew to about eight times its volume before the count began to rise. In a batch culture, CIZE peaks as exponential growth begins, when your cells are at their fittest. It falls as growth slows, and it is lowest in stationary phase.

<figure><img src="https://3226621149-files.gitbook.io/~/files/v0/b/gitbook-x-prod.appspot.com/o/spaces%2FuOGB3JuT2RALmbnviT9H%2Fuploads%2Fk79O8zqkBP7O4jyMlTQ2%2Fpf_ec_combined_growth_curve.png?alt=media&#x26;token=26bec733-6a29-44bd-a072-3af758d222df" alt="Cell count and CIZE through two batch cultures, E. coli on top and P. fluorescens below. In both, CIZE climbs during lag phase, peaks as exponential growth begins, and falls toward stationary phase while the count levels off."><figcaption><p>Cell count (lavender) and CIZE (dark line) through batch cultures of <em>E. coli</em> and <em>P. fluorescens</em>. In <em>P. fluorescens</em>, the count held at about 7 × 10^6 cells/mL for more than three hours while CIZE doubled. ACC is the acceleration phase. Error bars on <em>P. fluorescens</em> show the standard deviation of three replicates.</p></figcaption></figure>

Read CIZE as a curve, together with the count. There is no single right value. Each strain, medium and process has a curve of its own, so compare against your own reference run. Read more in [Measuring bacterial cell size](https://sbtinstruments.com/knowledge/measuring-bacterial-cell-size?utm_source=help-center\&utm_medium=referral).

## Put CIZE to work

CIZE is new to bacterial process development, and many of its uses are still to be found. Three stand out today.

* Time induction on the state of your cells, instead of on OD or the clock. Map how CIZE moves in a reference run. Then induce at the matching point on the CIZE curve when you change scale, process or medium.
* Watch for stress. Many stresses change cell size, and so do nutrient shifts and changes in feed. Cells shrink when nutrients run short, and they grow into long filaments when division is blocked. CIZE moved before the count in lag phase, so we expect it to be among the first signals when conditions turn against your cells.
* Follow product that builds up inside your cells. If inclusion bodies or storage compounds change the size of your cells, CIZE can show when the build-up starts.

## How the count relates to plate counts

Plate counts measure culturability, the cells that form a colony under your plating conditions. Through exponential and early stationary phase, the cell count and the plate count track closely. In the *E. coli* run above, the ratio between them averaged 1.01. See also [Precision and accuracy](/item-register/bactobox-r/precision-and-accuracy.md).

In decline phase, some time after growth stops, the two part ways. Cells lose the ability to form colonies, so plate counts fall. The cells are still there, so the count holds until they lyse.

<figure><img src="https://142487182-files.gitbook.io/~/files/v0/b/gitbook-x-prod.appspot.com/o/spaces%2FseAjVXi9YrPNSfdp1OXS%2Fuploads%2FDFiAyTQ6FF2j3awpUl1u%2FKlebsiella_decline.png?alt=media&#x26;token=31abaeef-4813-4f4c-874b-0880ff7091bd" alt="K. aerogenes growth curve. The BactoBox® cell count and the plate count overlap for the first 12 hours. In the shaded decline phase, the plate count falls while the cell count stays flat."><figcaption><p><em>K. aerogenes</em> in TSB, measured with BactoBox® (lavender) and plate counts (yellow), each in triplicate. The two overlap while the culture grows. In decline phase, in the shaded box, plate counts fall more than tenfold while the cell count holds. Data from <a href="https://doi.org/10.1016/j.mimet.2025.107284">Jordal et al. 2025</a>.</p></figcaption></figure>

We have not seen a culture lose culturability while its cell count was still rising. If culturability matters for your product, harvest as soon as the count shows that growth has stopped, or when CIZE levels off. See [Identify harvest time](/mpd/workflows/mpd1.md). To check which side of the peak you are on, [cross-check at end of fermentation](/mpd/workflows/cross-check.md).

{% hint style="info" %}
This page applies to [BacTotal-10](/advanced/measurements-explained/gating/bactotal-10.md), the default measurement program. If your BactoBox® runs another measurement program or custom gating, ask us how it applies to your data.
{% endhint %}

Next step: [Compare growth media](/mpd/mini-course/screen-growth-media.md)

Questions about your own process? [Contact us](https://sbtinstruments.com/contact).


---

# Agent Instructions
This documentation is published with GitBook. GitBook is the documentation platform designed so that both humans and AI agents can read, navigate, and reason over technical content effectively. Learn more at gitbook.com.

## Querying This Documentation
If you need additional information that is not directly available in this page, you can query the documentation by asking a question.

Perform an HTTP GET request on the following URL with the `ask` and `goal` query parameters:

```
GET https://help.sbtinstruments.com/mpd/interpreting-bactobox-r-data.md?ask=<question>&goal=<user_goal>
```

`ask` is the immediate question: it should be specific, self-contained, and written in natural language.
`goal` is what the user is ultimately trying to achieve, the reason they need the answer. Sharing it helps GitBook give you a better, more relevant answer. A goal is most helpful when it describes the outcome the user wants rather than restating the question. For example, with `ask=how do I create an API token`, a goal like `automate deployments from our CI pipeline` lets GitBook tailor the answer to that use case.

The response will contain a direct answer to the question and relevant excerpts and sources from the documentation.

Use this mechanism when the answer is not explicitly present in the current page, you need clarification or additional context, or you want to retrieve related documentation sections.
