> For the complete documentation index, see [llms.txt](https://help.sbtinstruments.com/llms.txt). Markdown versions of documentation pages are available by appending `.md` to page URLs; this page is available as [Markdown](https://help.sbtinstruments.com/mpd/mini-course/track-growth-curve.md).

# Track growth curve

This is the [MPD-7 workflow](/mpd/workflows/track-growth-curve.md) summarized to key steps.

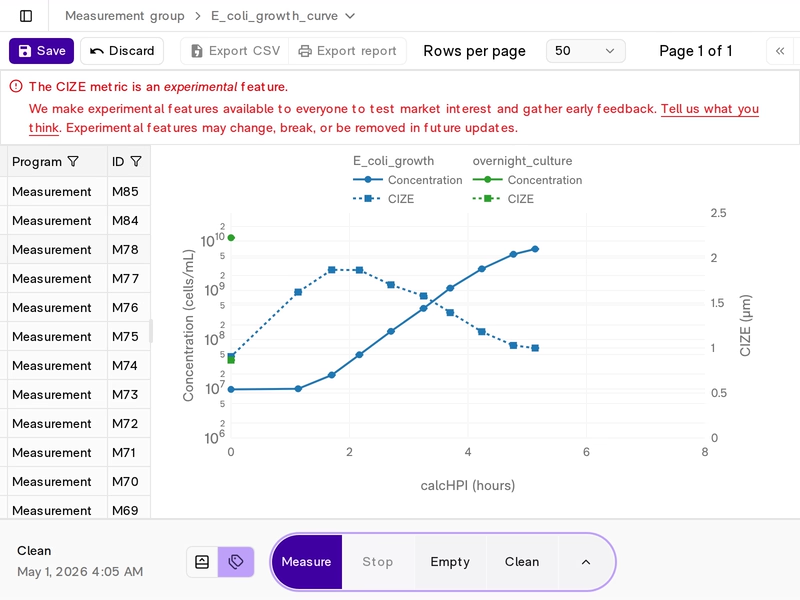
<figure><img src="/files/2U4rgLTmUYryFzypT5bp" alt=""><figcaption><p>Where you end up: a full growth curve, plotted live in Access.</p></figcaption></figure>

***

{% stepper %}
{% step %}

### Open Access

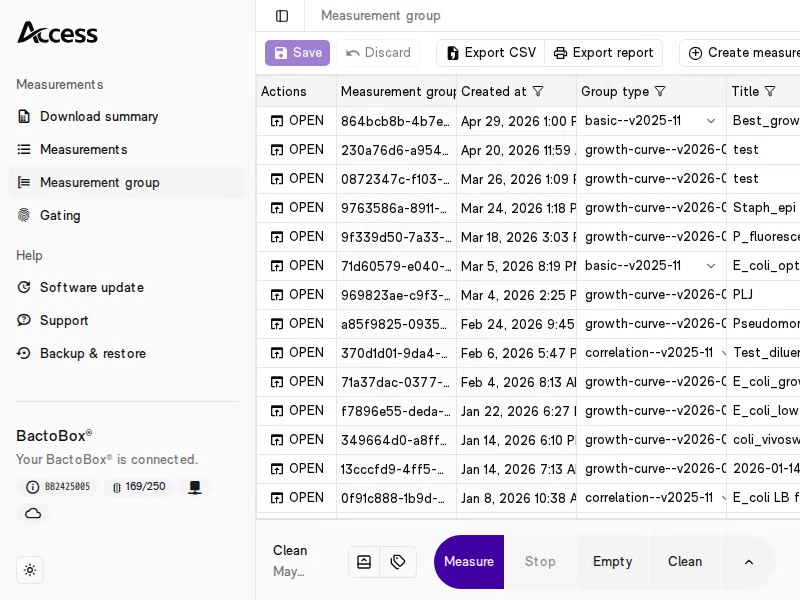
Connect your BactoBox® to your computer and open Access in your browser. The familiar BactoBox® buttons move onto your screen.

<figure><img src="/files/QCcFnsvDUxI5alqhS53v" alt=""><figcaption><p>Plug in your BactoBox® and open Access.</p></figcaption></figure>
{% endstep %}

{% step %}

### Create a measurement group

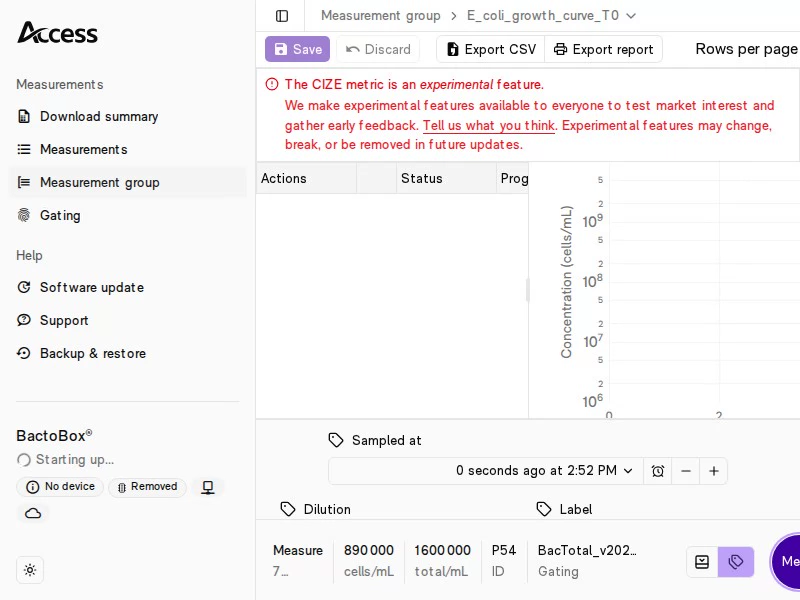
Start a *growth curve* measurement group. Every sample lands in the same place, ready to plot.

<figure><img src="/files/9FgEBih5hxWZ5TsUdEpP" alt=""><figcaption><p>One measurement group collects every sample.</p></figcaption></figure>
{% endstep %}

{% step %}

### Measure and annotate each sample

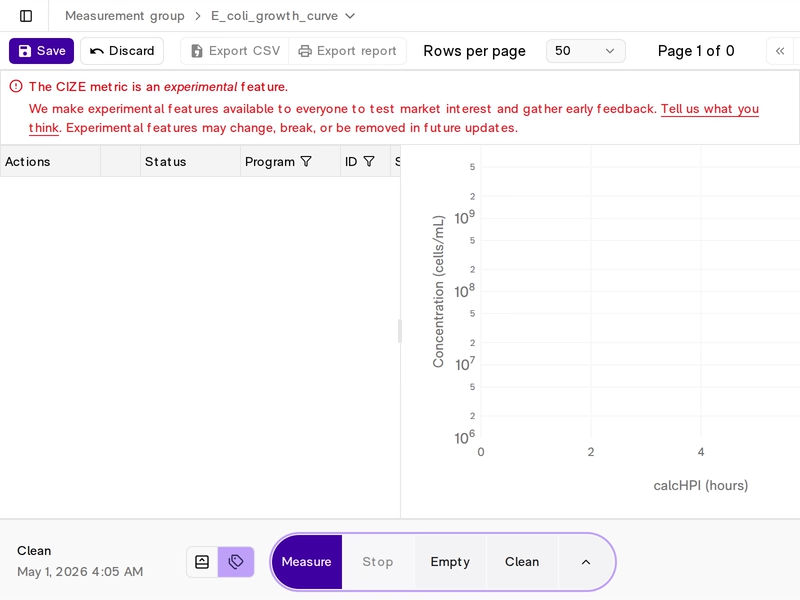
Set the dilution factor and a label, then click <kbd><mark style="background-color:purple;">Measure<mark style="background-color:purple;"></kbd> to run the measurement. Access works out the concentration in your flask. Use the same label for every sample in the series, for example `E_coli_growth`, then click that label above the chart to watch your curve build.

{% hint style="info" %}

#### The label is what ties the curve together

The label is not a free-form note. Access plots every measurement that shares a label as one growth curve, and places each point on the time axis by its measurement time. So give every sample in the series the same label. If you change the label between samples, you get scattered single points instead of one curve.
{% endhint %}

<figure><img src="/files/qePZ6XUwoP1GjKD98VZS" alt=""><figcaption><p>Annotate, measure, and the curve builds point by point.</p></figcaption></figure>
{% endstep %}

{% step %}

### Watch it reach stationary

Keep sampling, with a <kbd>Clean</kbd> after each measurement. Continue to see the onset of stationary phase.

<figure><img src="/files/z4UHtJ8zytW2Zzk1CE0g" alt=""><figcaption><p>The curve flattens as the culture reaches stationary phase.</p></figcaption></figure>
{% endstep %}
{% endstepper %}

***

## Do it yourself

That is the whole loop. The full guide walks you through sample prep, dilution schemes, and the medium check, step by step.

{% content-ref url="/pages/I0HcPYpXvMRDTZBltrbb" %}
[Track growth curve](/mpd/workflows/track-growth-curve.md)
{% endcontent-ref %}


---

# Agent Instructions
This documentation is published with GitBook. GitBook is the documentation platform designed so that both humans and AI agents can read, navigate, and reason over technical content effectively. Learn more at gitbook.com.

## Querying This Documentation
If you need additional information that is not directly available in this page, you can query the documentation dynamically by asking a question.

Perform an HTTP GET request on the current page URL with the `ask` query parameter, and the optional `goal` query parameter:

```
GET https://help.sbtinstruments.com/mpd/mini-course/track-growth-curve.md?ask=<question>&goal=<endgoal>
```

`ask` is the immediate question: it should be specific, self-contained, and written in natural language.
`goal` is optional and describes the broader end goal you are ultimately trying to accomplish on behalf of the user. GitBook uses it to tailor the answer towards what is most useful for that goal.

The response will contain a direct answer to the question and relevant excerpts and sources from the documentation.

Use this mechanism when the answer is not explicitly present in the current page, you need clarification or additional context, or you want to retrieve related documentation sections.