> For the complete documentation index, see [llms.txt](https://help.sbtinstruments.com/llms.txt). Markdown versions of documentation pages are available by appending `.md` to page URLs; this page is available as [Markdown](https://help.sbtinstruments.com/mpd/workflows/check-an-od600-calibration.md).

# Check an OD600 calibration

One E. coli culture, three methods. Cells per OD unit moved 11× during the run. The cell count averaged 1:1 against plate counts.

In this work, we show how BactoBox® can be used to check whether an OD<sub>600</sub> calibration holds through a growth curve.

Most labs treat optical density as a fixed conversion into cells, set by the strain and the medium. For example, OD<sub>600</sub> = 1 is taken to mean 5 × 10^8 cells/mL.

In this study, OD<sub>600</sub> = 1 meant anything from 1.6 × 10^8 to 1.8 × 10^9 cells/mL. The strain, the medium and the flask stayed the same. Only the point in the growth curve changed, and the factor moved 11×.

How optical density relates to your cells depends on the strain, the medium, the growth conditions and where in the growth curve you are. That makes it a poor tool to compare processes, or to build process understanding on.

## Take-home messages

* The number of cells behind one OD unit rose 11× across one growth curve, from 1.6 × 10^8 to 1.8 × 10^9 cells/mL per OD unit.
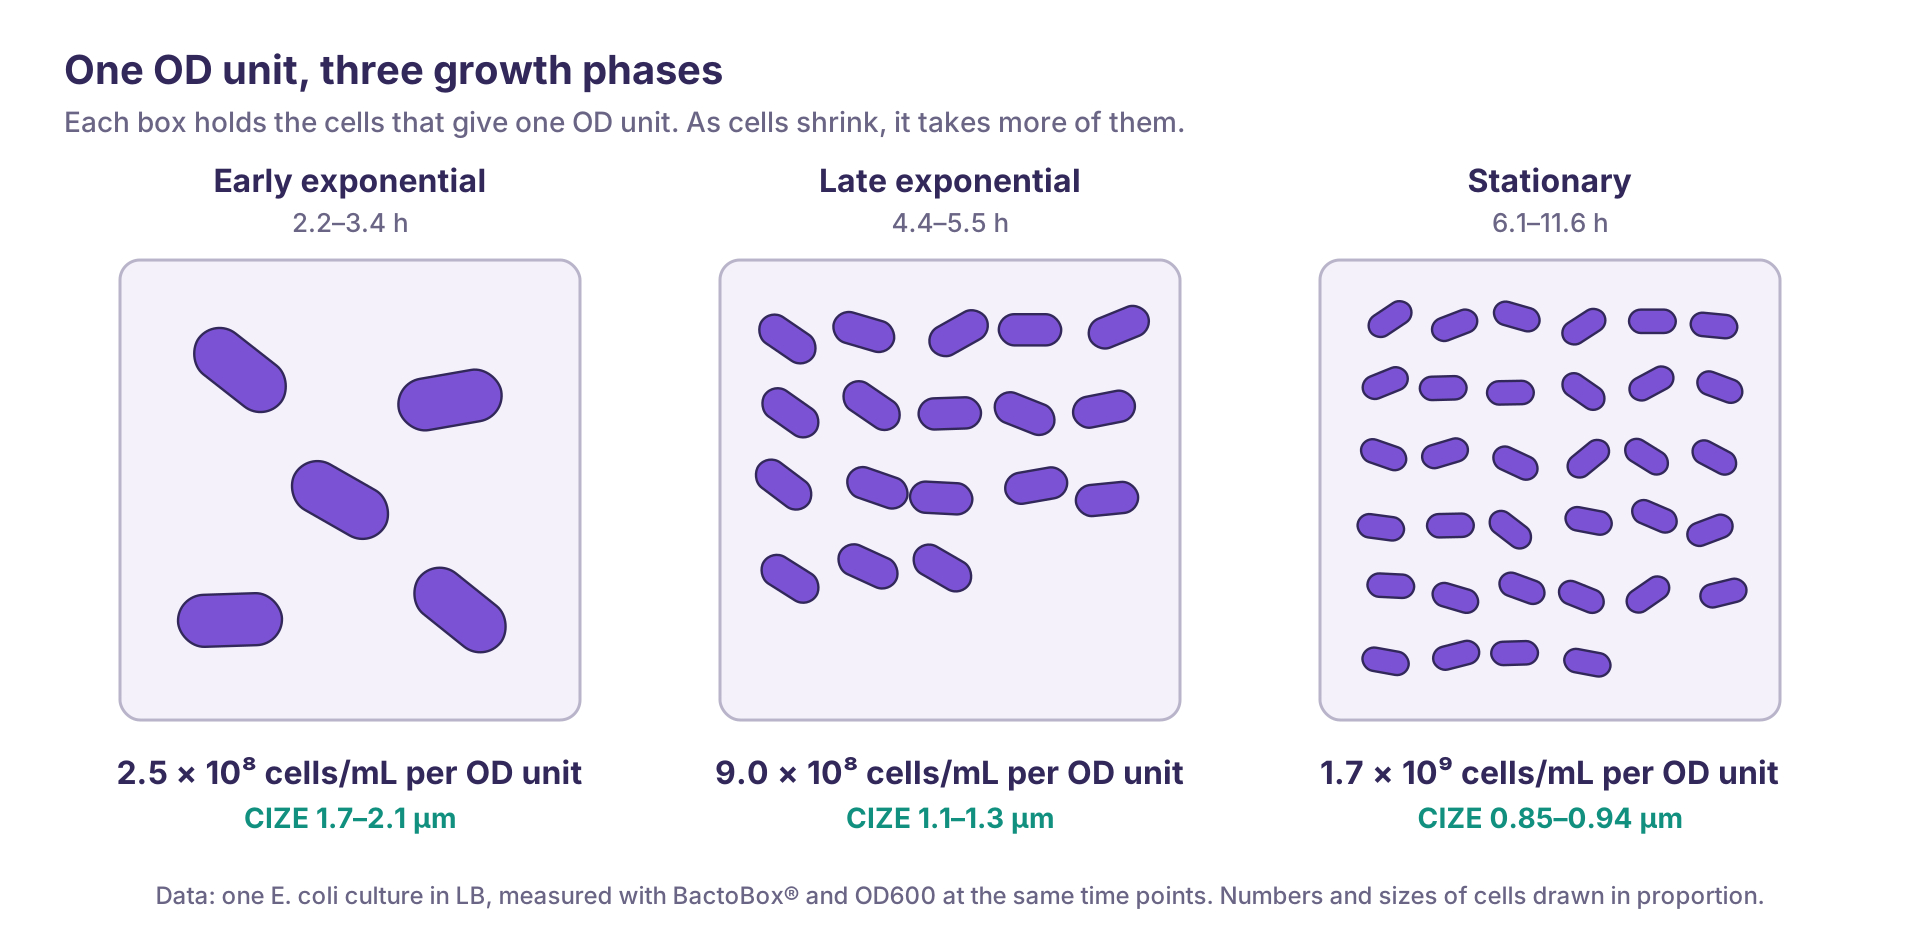
* The drift followed cell size. CIZE fell from 2.13 µm to 0.85 µm, and the cells per OD unit rose as the cells shrank.

## Study design

* One *E. coli* ATCC 8739 culture in LB medium, in a shake flask at 37 °C and 200 rpm. Seeded at 1 × 10^6 cells/mL.
* 28 samples over 11.6 hours.
* Each sample measured with BactoBox® (cells/mL and CIZE), with Compact Dry TC plate counts (CFU/mL), and with OD<sub>600</sub> in an Implen Diluphotometer with standard cuvettes.
* Each sample diluted into the linear range of each method. One measurement per method.

The [protocol](/mpd/workflows/check-an-od600-calibration/protocol.md) gives every step.

## Results

### OD<sub>600</sub> sees nothing in the first tenfold of growth

OD<sub>600</sub> read 0.00 ± 0.01 AU for the first nine samples, below its detection limit of 0.03 AU. The first reading above the limit came at 2.2 hours. By then the culture held more than 1 × 10^7 cells/mL. BactoBox® measured every sample from the seed onwards, each diluted into its working range.

<figure><img src="https://142487182-files.gitbook.io/~/files/v0/b/gitbook-x-prod.appspot.com/o/spaces%2FseAjVXi9YrPNSfdp1OXS%2Fuploads%2FUWyAS4G2Te8gC5aH1Z1I%2Fbactobox_cfu_od_cize_BB_CFU.png?alt=media&#x26;token=d396a1d8-1da7-4b73-8b73-cb4d09b81183" alt=""><figcaption><p>The <em>E. coli</em> culture measured with BactoBox® (lavender), plate counts (yellow) and OD<sub>600</sub> (red). CIZE from BactoBox® is green, on the secondary axis. The y-axis is linear inside the grey band, which marks the OD<sub>600</sub> detection limit, and logarithmic above it.</p></figcaption></figure>

### The OD<sub>600</sub> factor drifts with cell size

<figure><img src="https://142487182-files.gitbook.io/~/files/v0/b/gitbook-x-prod.appspot.com/o/spaces%2FseAjVXi9YrPNSfdp1OXS%2Fuploads%2FrhDxL69ZwK9vNHgayKJ9%2Fod600--cells-per-od-unit.png?alt=media" alt="Three boxes, each holding the cells that give one OD unit. Early exponential, 2.2–3.4 h: 2.5 × 10^8 cells/mL per OD unit, CIZE 1.7–2.1 µm. Late exponential, 4.4–5.5 h: 9.0 × 10^8, CIZE 1.1–1.3 µm. Stationary, 6.1–11.6 h: 1.7 × 10^9, CIZE 0.85–0.94 µm."><figcaption><p>The cells behind one OD unit in each growth phase, and their size. These are phase averages. Across single time points the ratio moved 11×. Numbers and sizes of cells are drawn in proportion.</p></figcaption></figure>

Turbidity follows the cross-section of each cell. Halve the diameter, and each cell scatters about a quarter as much light. More cells therefore sit behind each OD unit as the cells shrink. Over this curve, the cells per OD unit scaled with CIZE to the power of −2.5.

The drift runs in one direction, so more replicates do not average it away. Calibrate early in the curve, and every later number reads too low. Calibrate late, and every earlier number reads too high.

<figure><img src="https://142487182-files.gitbook.io/~/files/v0/b/gitbook-x-prod.appspot.com/o/spaces%2FseAjVXi9YrPNSfdp1OXS%2Fuploads%2FaD17Segkr7S6bmilej2q%2Fbactobox_cfu_od_cize_stability.png?alt=media&#x26;token=6272fa39-1342-4812-bd1c-7366e2109d80" alt=""><figcaption><p>Ratios between the methods over time. The BactoBox®-to-plate count ratio stays close to 1 across four decades of growth. The ratios per OD unit climb as the cells shrink.</p></figcaption></figure>

### The cell count tracks plate counts

BactoBox® and plate counts both count, so cell size does not enter their ratio. It averaged 1.01 across the run (geometric mean). It varied 2.2× in total, which is expected for single plate counts. That is five times less than the cells per OD unit.

## What it means for your process

A cells-per-OD factor holds for one strain, in one medium, in one growth phase. Outside those bounds it carries an error you cannot see in the OD<sub>600</sub> reading.

The error is largest where you need the factor most, when you compare a culture early with itself late, or two conditions that grow at different rates. Growth rates read from OD<sub>600</sub> carry the same error.

Cell counts need no factor of your own. They follow growth directly, from the seed onwards.

## Related workflow

[Track a growth curve](/mpd/mini-course/track-growth-curve.md)

Questions about your own process? [Contact us](https://sbtinstruments.com/contact).


---

# Agent Instructions
This documentation is published with GitBook. GitBook is the documentation platform designed so that both humans and AI agents can read, navigate, and reason over technical content effectively. Learn more at gitbook.com.

## Querying This Documentation
If you need additional information that is not directly available in this page, you can query the documentation by asking a question.

Perform an HTTP GET request on the following URL with the `ask` and `goal` query parameters:

```
GET https://help.sbtinstruments.com/mpd/workflows/check-an-od600-calibration.md?ask=<question>&goal=<user_goal>
```

`ask` is the immediate question: it should be specific, self-contained, and written in natural language.
`goal` is what the user is ultimately trying to achieve, the reason they need the answer. Sharing it helps GitBook give you a better, more relevant answer. A goal is most helpful when it describes the outcome the user wants rather than restating the question. For example, with `ask=how do I create an API token`, a goal like `automate deployments from our CI pipeline` lets GitBook tailor the answer to that use case.

The response will contain a direct answer to the question and relevant excerpts and sources from the documentation.

Use this mechanism when the answer is not explicitly present in the current page, you need clarification or additional context, or you want to retrieve related documentation sections.