> For the complete documentation index, see [llms.txt](https://help.sbtinstruments.com/llms.txt). Markdown versions of documentation pages are available by appending `.md` to page URLs; this page is available as [Markdown](https://help.sbtinstruments.com/mpd/workflows/mpd1/protocol.md).

# Protocol

The steps, materials and settings we used to find the harvest time of a shake flask culture.

This is what we did, step by step, with the materials and settings we used.

## What we used

* *S. epidermidis*, and an earlier growth curve of it under the same conditions. We used the curve to time the start of sampling.
* TSB (tryptic soy broth).
* A shake flask, for example 50 mL TSB in a 250 mL flask, and an incubator shaker.
* BactoBox® with a flow cell, and a computer with Access.
* Dilution vials with 10 mL diluent, six per sample.
* Disinfection vials.
* One 5 mL tube per sample, and a rack for them.
* A cold rack for 5 mL tubes, for example an ice rack or a chill block. A polystyrene box with ice and water also works.
* A 2 mL serological pipette with a pipette controller.
* A P200 pipette with sterile tips.
* A vortex mixer.
* Materials for plate counts in triplicate.

Our run lasted 22.6 hours from inoculation to the last sample.

<figure><img src="https://142487182-files.gitbook.io/~/files/v0/b/gitbook-x-prod.appspot.com/o/spaces%2FseAjVXi9YrPNSfdp1OXS%2Fuploads%2FlC7T1yb3W9elrbWwvX4B%2FGet_these_things_ready.JPG?alt=media&#x26;token=00477e43-a8f6-4dc1-9698-5e484c27b582" alt="Bench items for sampling and diluting"><figcaption><p>The items we used at the bench for this protocol.</p></figcaption></figure>

## What we did

{% stepper %}
{% step %}

### Timing of inoculation

We started sampling when the culture entered deceleration phase. We timed this from an earlier growth curve of the same culture.

We kept the strain, medium, flask, seed concentration and incubation settings the same as in the earlier curve. The culture then reached deceleration phase after the same incubation time. We worked back from the time we wanted to start sampling to find when to inoculate.

Sampling ran from deceleration phase into stationary phase.

{% hint style="info" %}
If you do not have an earlier growth curve, run [Track a growth curve](https://help.sbtinstruments.com/mpd/track-growth-curve.md) first. To sample every hour to the end, work in shifts. One person inoculates and checks the culture, and another takes over the sampling.
{% endhint %}
{% endstep %}

{% step %}

### Growth curve measurement group

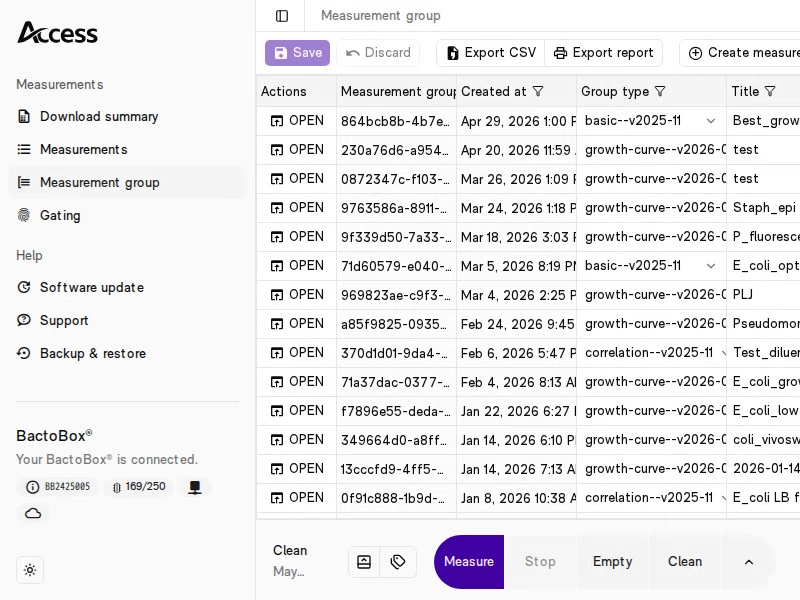
In Access, we created a measurement group of the type *Growth curve*, and opened it. Every measurement we started then joined the group. Access plotted cells/mL and CIZE against time as we went. See [Create and open measurement groups](https://help.sbtinstruments.com/more/software/create-and-open-measurement-groups.md).

<div data-with-frame="true"><figure><img src="https://142487182-files.gitbook.io/~/files/v0/b/gitbook-x-prod.appspot.com/o/spaces%2FseAjVXi9YrPNSfdp1OXS%2Fuploads%2Fgit-blob-821f7c540d21dc1ed4675e9d5cc893c6c3007cb7%2FGrowth_curve_create.avif?alt=media" alt="The create measurement group form in Access"><figcaption><p>We created a measurement group of the type <em>Growth curve</em>.</p></figcaption></figure></div>
{% endstep %}

{% step %}

### Inoculation

We inoculated the flask with the same seed as in the earlier curve. We noted the time, and put the flask in the incubator shaker.
{% endstep %}

{% step %}

### Sampling

We started when the culture entered deceleration phase. In Access, we pressed the clock icon next to *Sampled at*. It set the time to now. See [Do measurements in Access](https://help.sbtinstruments.com/everyday-use/do-measurements-in-access.md).

Then, straight away, we pulled 1 mL of culture into a 5 mL tube with the serological pipette. We put the flask back in the shaker.
{% endstep %}

{% step %}

### Dispersal and cooling

We vortexed the tube for 1 min at maximum speed to disperse cells. A clump counts as one event, so clumps must be broken up before dilution.

{% hint style="info" %}
If your strain forms clumps or chains, vortexing may not be enough. See [Break up cell clumps](https://help.sbtinstruments.com/more/how-to-guides/break-up-cell-clumps.md).
{% endhint %}

We put the tube on the cold rack straight after, and let it cool for at least 1 min. Cold slows division, so the count did not drift while we diluted and measured the three repeats.
{% endstep %}

{% step %}

### Dilution and measurement

In deceleration phase the culture usually holds 1 × 10^9 to 1 × 10^10 cells/mL. We used a 1:10 000 dilution to bring it into the working range. See [Hit the right concentration](https://help.sbtinstruments.com/more/how-to-guides/hit-the-right-concentration.md).

1. We transferred 101 µL of the sample to a dilution vial with 10 mL diluent. We vortexed for 10 s at maximum speed. This was 1:100.
2. We transferred 101 µL of the 1:100 dilution to a second dilution vial. We vortexed for 10 s at maximum speed. This was 1:10 000.
3. We put the tubing kit in the 1:10 000 vial.
4. In Access, we set *Dilution* to 10 000 and *Label* to the same label for every sample, for example `S_epidermidis_TSB`. We pressed <kbd>Measure</kbd>.
5. We cleaned as in [Run a sample](https://help.sbtinstruments.com/everyday-use/run-a-sample.md).

Access multiplied the result by the dilution and showed cells/mL in our culture.

<figure><img src="https://142487182-files.gitbook.io/~/files/v0/b/gitbook-x-prod.appspot.com/o/spaces%2FseAjVXi9YrPNSfdp1OXS%2Fuploads%2F3K0zqcF480QTk5Kk9Elf%2FOptiseeding_-7_workup_1%3B10000.avif?alt=media&#x26;token=f8ffaef4-1831-4dc0-b5fe-699684685794" alt="Animation of a sample workup to 1:10 000"><figcaption><p>Workup of a sample to a 1:10 000 dilution.</p></figcaption></figure>
{% endstep %}

{% step %}

### Repeats

Each repeat was a fresh dilution series from the same sample. We kept the sample on the cold rack. We vortexed it briefly before we took 101 µL for the next series. Then we diluted and measured as in the step above.

We kept the same *Label* and the same *Sampled at* time for all three repeats. We did not press the clock icon again. Access then treated the three results as replicates and plotted their mean.
{% endstep %}

{% step %}

### Plating

We made plate counts of each sample, in triplicate. We used our cell count to choose the plating dilution, and plated one tenfold dilution on either side of it too.
{% endstep %}

{% step %}

### Hourly sampling and stop rule

We repeated the last five steps about every hour, through deceleration phase and into stationary phase. We left longer gaps at the end of our run.

After each sample, we worked out the relative change per hour since the previous sample. We used the mean of the three repeats. We hovered over a point in the Access plot to read its time and mean cells/mL.

Relative change per hour = (this mean − previous mean) / this mean / hours between the two samples × 100 %

For example, from 11.8 to 14.9 hours our mean went from 7.17 × 10^9 to 7.07 × 10^9 cells/mL. That is (7.07 − 7.17) / 7.07 / 3.1 = −0.5 % per hour.

We stopped when two samples in a row changed less than 5 % per hour, up or down. In our run that happened at 22.6 hours. The first of those points, 11.8 hours, is where division stopped.

<div data-with-frame="true"><figure><img src="https://142487182-files.gitbook.io/~/files/v0/b/gitbook-x-prod.appspot.com/o/spaces%2FseAjVXi9YrPNSfdp1OXS%2Fuploads%2FKPJHc8mdOOwjsGO9TvJ3%2Fmpd1-harvest-access-avg.avif?alt=media&#x26;token=483d51e6-36e5-4d81-a5dd-d37e1d10917f" alt="Growth curve plot in Access with a tooltip"><figcaption><p>The growth curve in Access, where the tooltip shows the time and mean cells/mL of a point.</p></figcaption></figure></div>

{% hint style="info" %}
To be sure growth has stopped, let the flask incubate overnight and measure once more in the morning. If the count has risen a lot, the culture paused and then grew again. Repeat the run, and wait for four samples in a row below 5 % per hour.
{% endhint %}
{% endstep %}
{% endstepper %}

## Analysis

We took the mean of the three BactoBox® repeats at each sample, with the standard deviation as error bars. Then we found the harvest time in four steps:

1. We opened the measurement group and hovered over the plot to read the mean cells/mL at each point.
2. We found the points with the highest means.
3. If their error bars overlapped, we took the earliest of them. Its incubation time was the harvest time.
4. We read the CIZE at that point. Access plotted it with the count.

We applied the same rule to the means of the plate counts, and compared the two harvest times.

<figure><img src="https://142487182-files.gitbook.io/~/files/v0/b/gitbook-x-prod.appspot.com/o/spaces%2FseAjVXi9YrPNSfdp1OXS%2Fuploads%2Fn71YRnTLFNPnc1KmAsrZ%2Finspect-error-bars-tricky.png?alt=media&#x26;token=a8e1603e-cdae-47a9-a692-f5c23b27143d" alt="Illustration of a growth curve with overlapping error bars"><figcaption><p>Illustration of overlapping error bars, where the earlier green point, not the higher red one, gives the harvest time.</p></figcaption></figure>

{% hint style="info" %}
If you want a stricter test, download the CSV file from the measurement group. Run a Student's *t*-test on the repeats of the highest points. Take the earliest point after which the count no longer rises significantly.
{% endhint %}

Questions about your own process? [Contact us](https://sbtinstruments.com/contact).


---

# Agent Instructions
This documentation is published with GitBook. GitBook is the documentation platform designed so that both humans and AI agents can read, navigate, and reason over technical content effectively. Learn more at gitbook.com.

## Querying This Documentation
If you need additional information that is not directly available in this page, you can query the documentation by asking a question.

Perform an HTTP GET request on the following URL with the `ask` and `goal` query parameters:

```
GET https://help.sbtinstruments.com/mpd/workflows/mpd1/protocol.md?ask=<question>&goal=<user_goal>
```

`ask` is the immediate question: it should be specific, self-contained, and written in natural language.
`goal` is what the user is ultimately trying to achieve, the reason they need the answer. Sharing it helps GitBook give you a better, more relevant answer. A goal is most helpful when it describes the outcome the user wants rather than restating the question. For example, with `ask=how do I create an API token`, a goal like `automate deployments from our CI pipeline` lets GitBook tailor the answer to that use case.

The response will contain a direct answer to the question and relevant excerpts and sources from the documentation.

Use this mechanism when the answer is not explicitly present in the current page, you need clarification or additional context, or you want to retrieve related documentation sections.